More Debug Fun
More debugging options for the PET 2001 emulator.

There are times when your 6502 code doesn’t behave, where it steers off of its path into directions, never intended, when it runs away.
The new debugging traps for the PET 2001 emulator are meant for exactly those times. And they may be helpful for reverse engineering, as well.
Simply put, they are for those “How did we end up here?” moments. And the “Holy electron, Batman, what’s happening?” moments, as well.
In a nutshell, there are now
- a new breakpoint type for bracketed address ranges, which triggers either when the program counter enters or exits a given range
- a new trap for “illegal” instructions
- a CPU log of the last 1,000 instructions executed, which is kept regardless of any other trace options
- options to include or ignore interrupts and the new “illegal” instructions trap can be toggled anytime (previously, the “ignore interrupts” checkbox could be toggled only when the emulator was halted and the debugger became interactive)
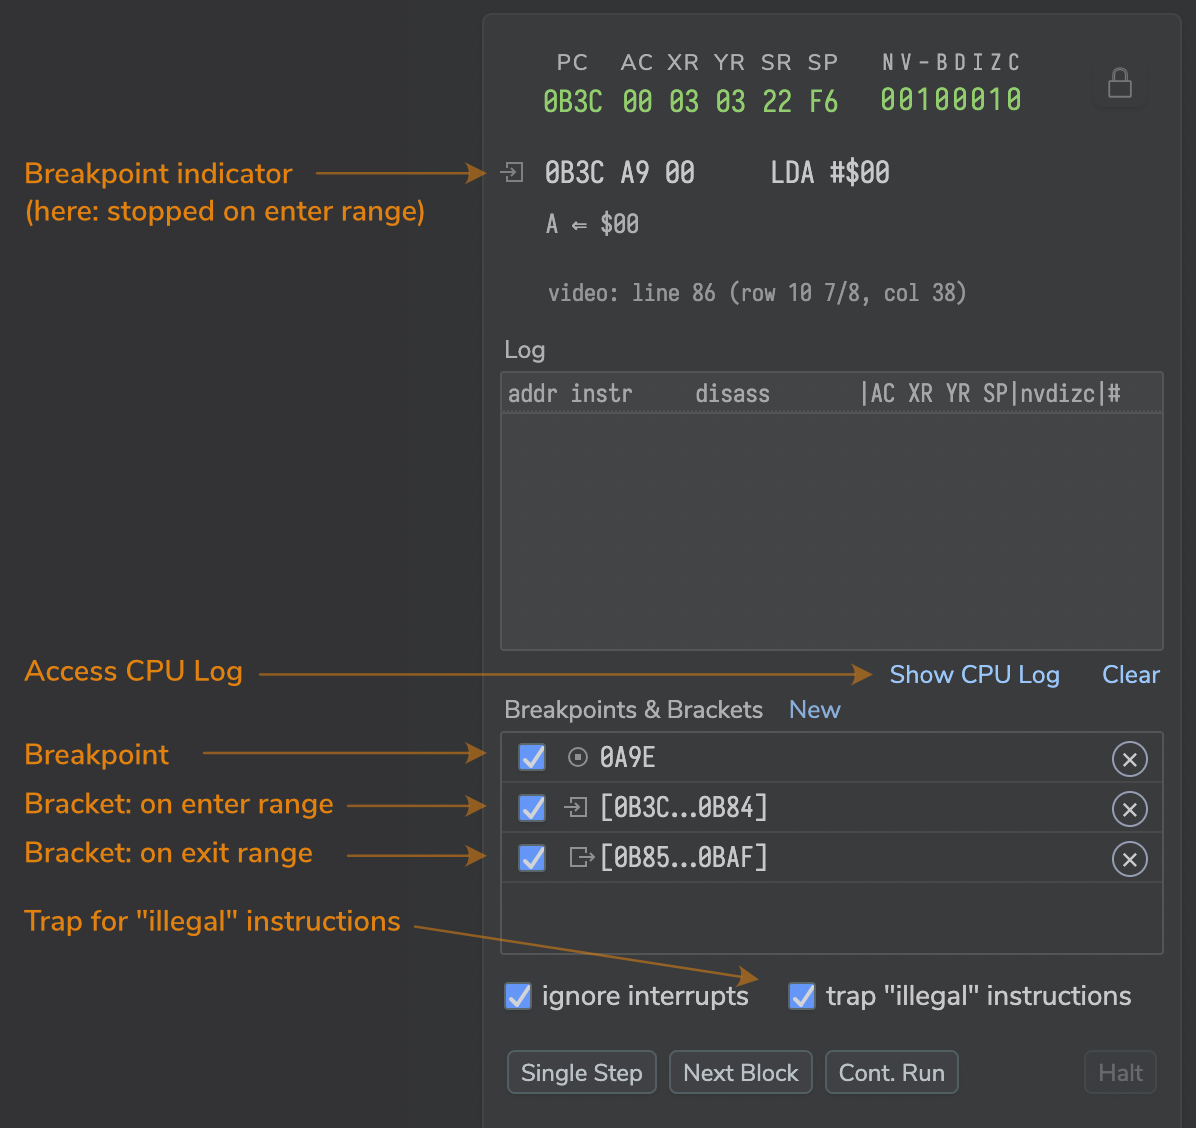
- a breakpoint indicator showing, on which type of breakpoint the emulator had been halted.
Let’s have a closer look (the debugger is available by its icon at to top-right corner of the browser window):
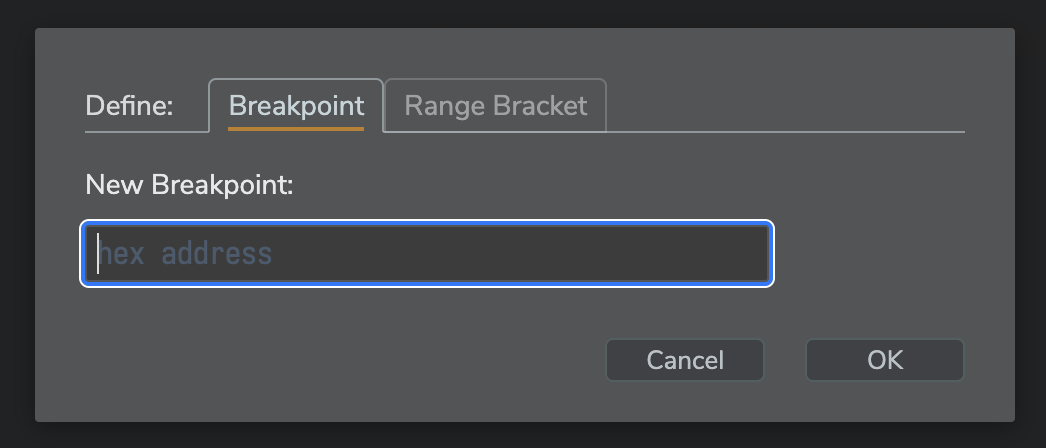
As before, new breakpoints, both simple ones and range brackets are set by the “New” button/link. This opens a new dialog, providing tabbed options, either for a simple breakpoint or a new range bracket. For breakpoints, it can be simply operated, just like with the previous prompt dialog: just type the address and hit ENTER.
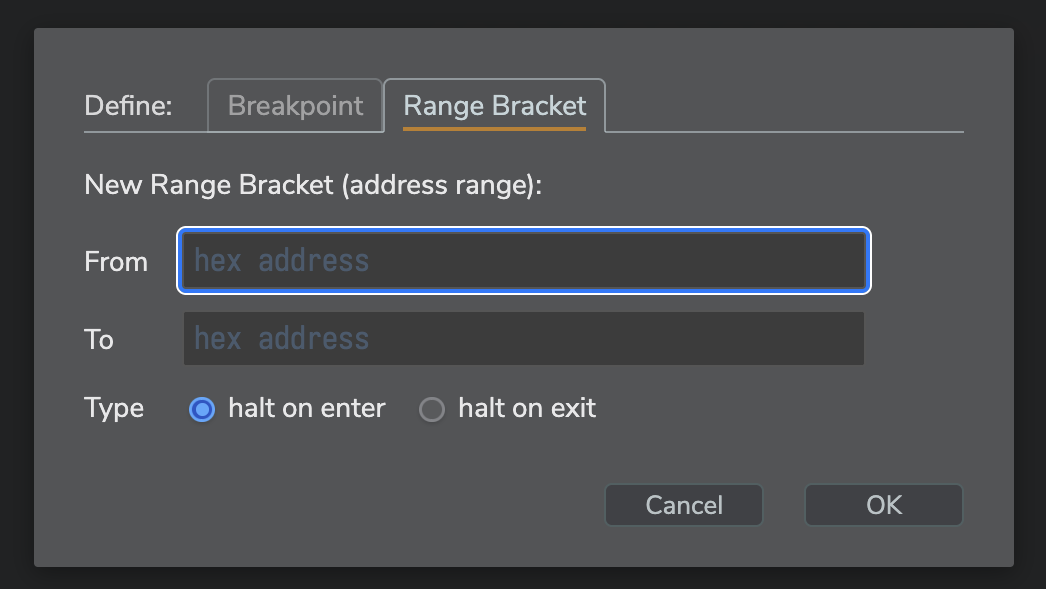
For range brackets, it’s a bit more complex, but you may tab your way through the individual controls.
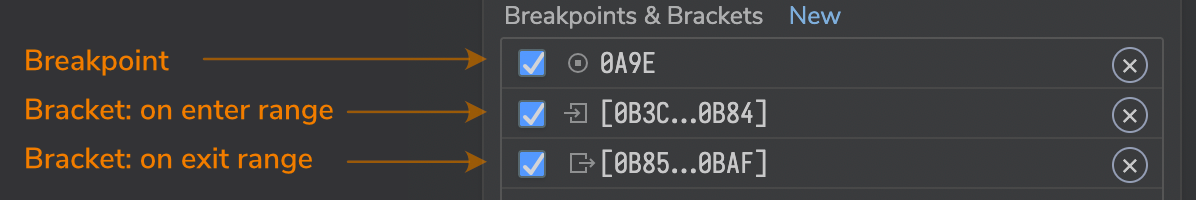
In the breakpoints list, the type of a breakpoint will be indicated by an icon before the address or address range. The same icons are also displayed at the mini-disassembly for the current instruction, whenever a breakpoint triggers.
“Illegal” instructions come with a special indicator icon of their own:
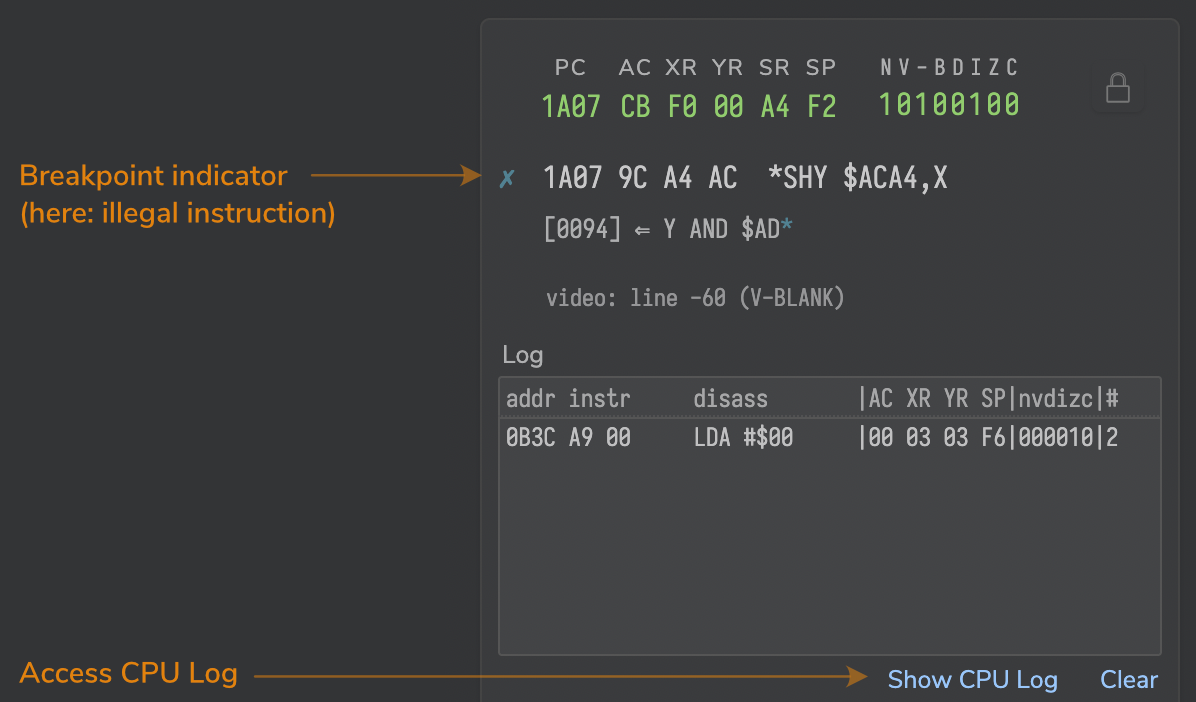
(here, the trap for ”illegal” instructions triggered and halted the emulator.)
For the all-important question, “how did we end up here?”, click the button/link “Show CPU Log” beneath the trace window. This will show a dialog with a log of the last 1,000 instructions executed, ready for copy-and-paste. (The format is similar to the trace, but includes the status register, just like the CPU read-out, and flags bits are rendered as initials in upper and lower case for high and low, respectively, so that it may be easier to interpret them in a long list.)
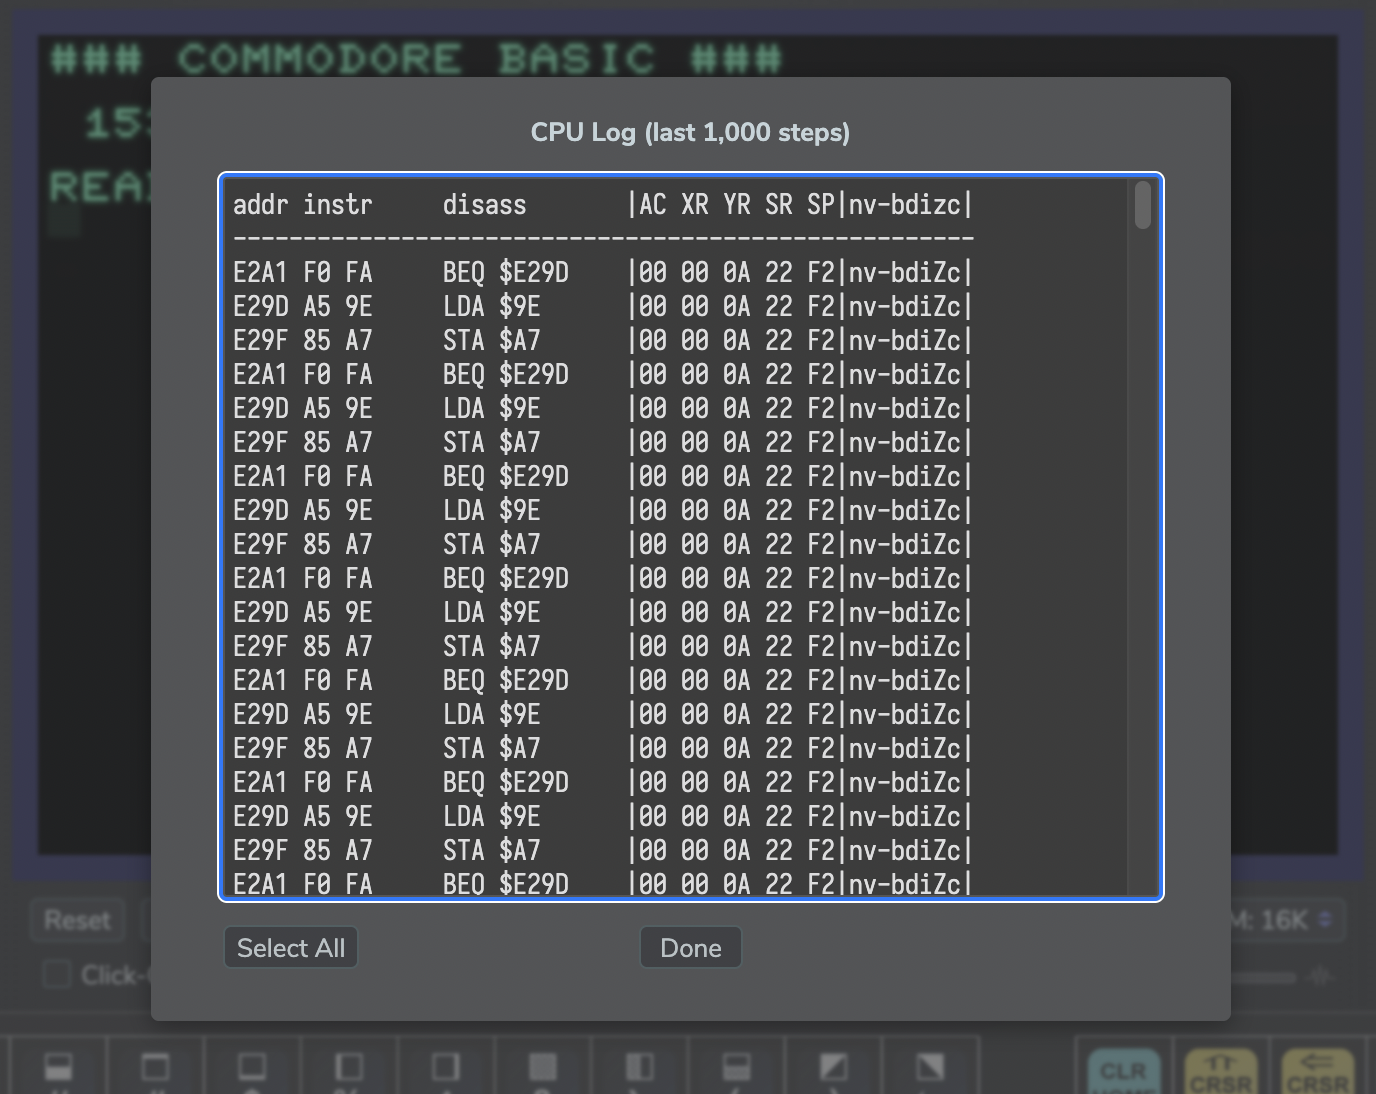
This is rather important for any range brackets triggering on exit: since a breakpoint or trap triggers on the very beginning of the execution of an instruction, PC will point to the new address already. To see how this happened, consult the CPU log. (More often than not an interrupt sequence may be involved.)
IMPORTANT: Mind that the option “ignore interrupts” (default on) also adheres to range brackets. If unchecked, these would trigger on any interrupt.
The CPU log can be brought up using the keyboard, as well: just hit SHIFT + ALT/OPTION + ENTER.
This works not only inside the debugger, but anytime, whenever the CPU is running and the emulator is scanning for input.
— Have fun! —
Norbert Landsteiner,
Vienna, 2025-04-02