Chasing the Hare in the Mandelbrot Set
Binary Grain and Numeric Precision
Images from the outer limits of numeric precision.
Take any numeric renderer which allows you to zoom in repeatedly. For instance a Mandelbrot set renderer, because, Mandelbrot sets are always fun. For instance this one (by yours truely). As you keep zooming in and zooming in, and, after a while, eventually, the rendered image will suddenly show pixelation. And as you are zooming in again, the pixels will just increase in size. However, this is not a fault of the visualization layer, it’s just that you hit the mathematical barrier of numeric precision. The grain in binary computers…
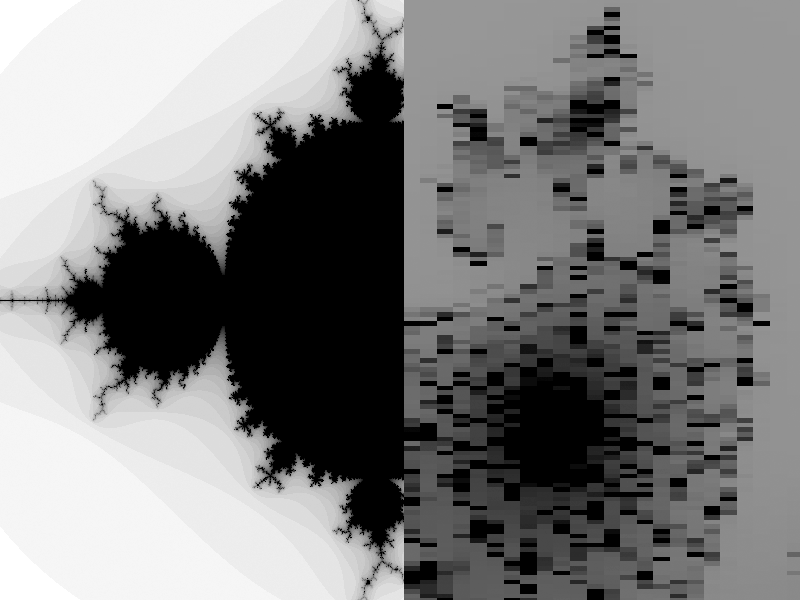
Pixelation is due to lack of numeric precision.
The Mandelbrot Set
Trying to educate anyone on the Mandelbrot set may be quite a vain endeavor, nowadays, due to its popularity. However, for completeness’ sake, here you are:
The Mandelbrot set describes the behavioral limits of a growth function ( znew = zold2 + c(r,i) ) of a set of complex numbers, usually visualized as a plane described by a real axis (r) and an imaginary axis (i). Starting from zero (z0 = 0), some complex numbers for the additive constant c show a stable behavior, zeroing in on a specific position on the complex plane, while others will behave unstable with z tending towards infinity. This behavior is exactly what we are mapping. As it turns out, values with stable behavior are only found in the range of −2...2 for the imaginary and real components of c and any value giving an absolute result for z greater than 2 at any time will “blow up” eventually.
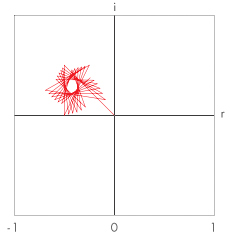
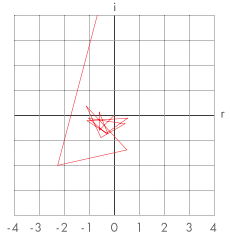
Therefore, we may implement a simple test, iterating over the complex numeric set for c, and test, if the growth function will stay inside this specific bound (m = 2 ≥ z) for a given number of iterations (n), or, if it will break the bound previously (tending towards infinity). If we break out, we visualize the number of iterations (k < n) this took as a color or shade of gray in front of a black background, which represents those values where the growth function doesn’t break the limit (m) and behaves stable.
c(r,i), z(r,i): complex numbers
n: number of test iterations

foreach (cr) {
   foreach (ci) {
      z(r,i) = 0;
      loop: for (k = 0...n, step 1) {
         z = z2 + c;
         if (|z| > 2) {
            // unstable, map it by coordinates and iteration
            setPixel(cr, ci, color(k));
            exit loop;
         }
      }
   }
}
As we map the regions of stability and instability, we arrive at an amazing pattern of inifinite, delicate detail, where even an infinitely small step along any of the two axes (components of c) or just an iteration more can make a huge difference. (This is also, why the Mandelbrot set has become somewhat an icon for chaos theory.)
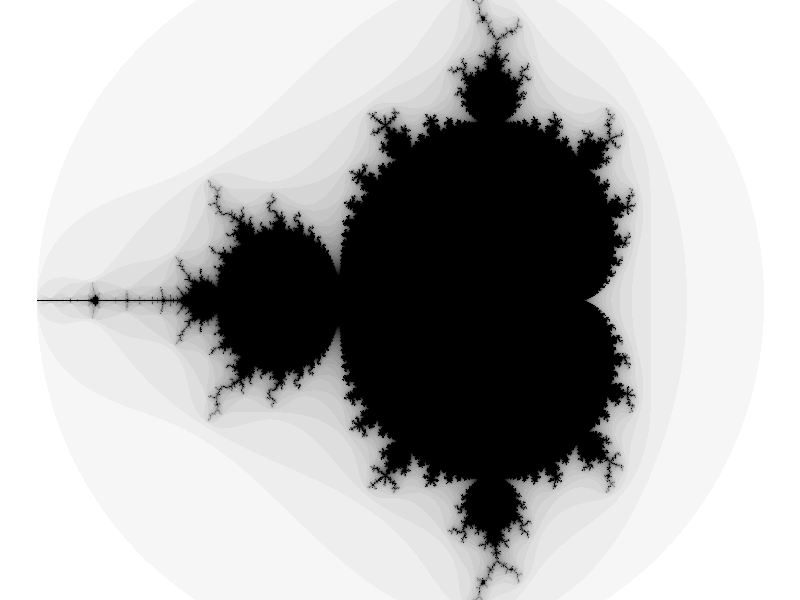
Aspect: r = −2.15 … 1.15, i = −1.10 … 1.10, n = 31.
(Select “aspect ratio 1 : 1.125” for this configuration.)
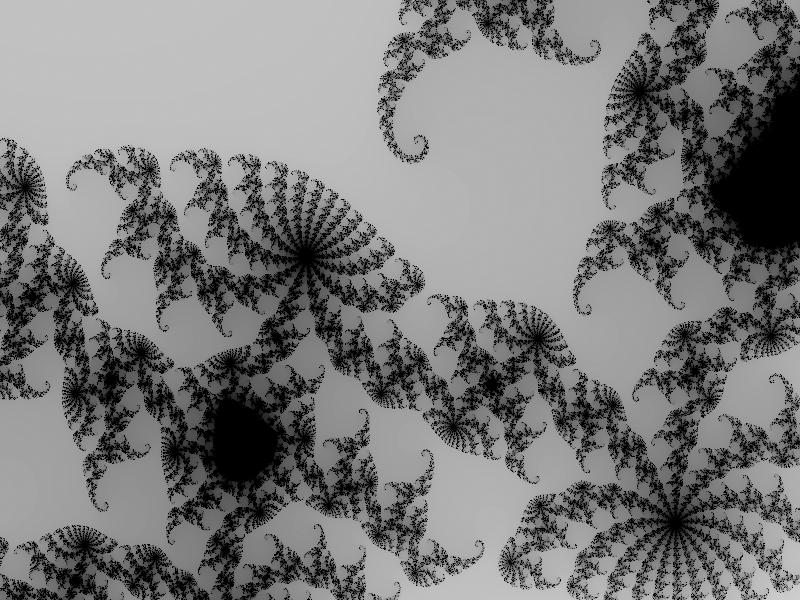
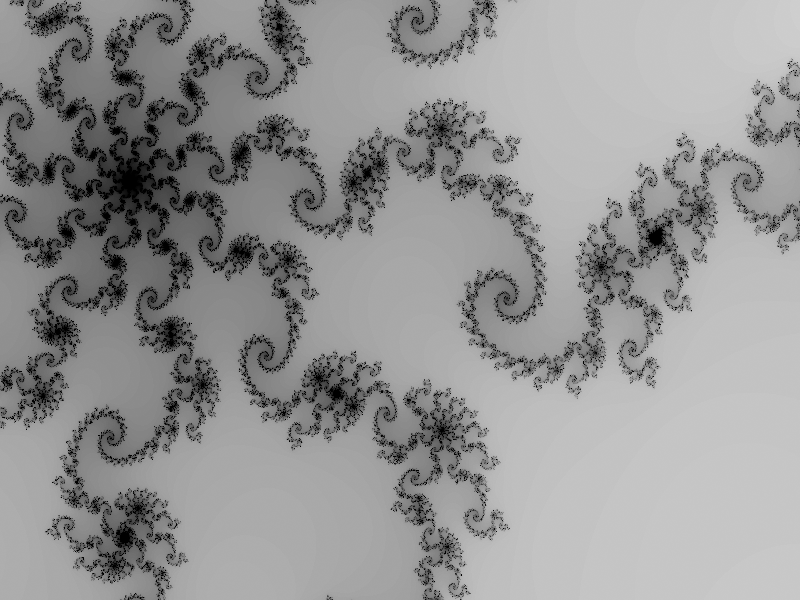
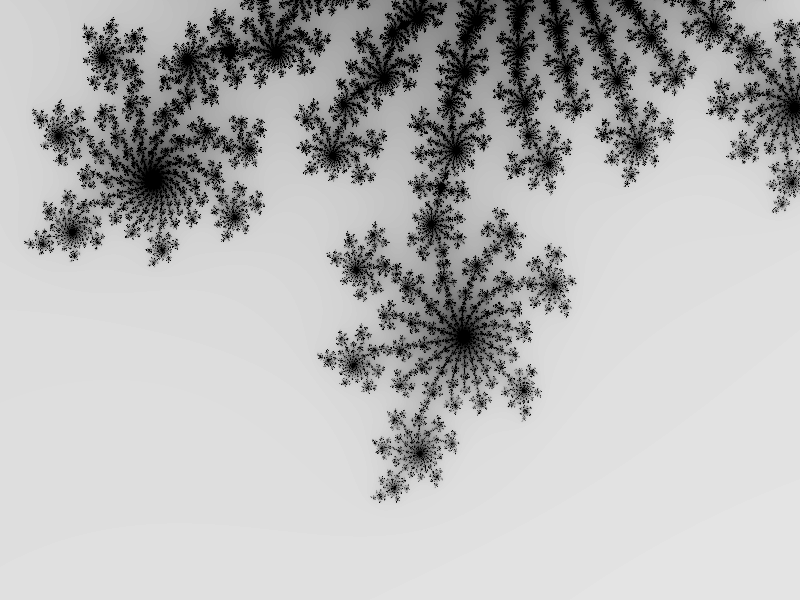
Since visualizations of the Mandelbrot set are well known for their fractal beauty and self-similarity, playing around with it by trying various ranges of r and i for c and varying values for n (which is much like setting the exposure) is certainly fun. Even more so, if you can just click to zoom or select a new aspect in the rendered image, thus adding yourself to a virtually never ending loop of recursions.
Some Aspects of Beauty
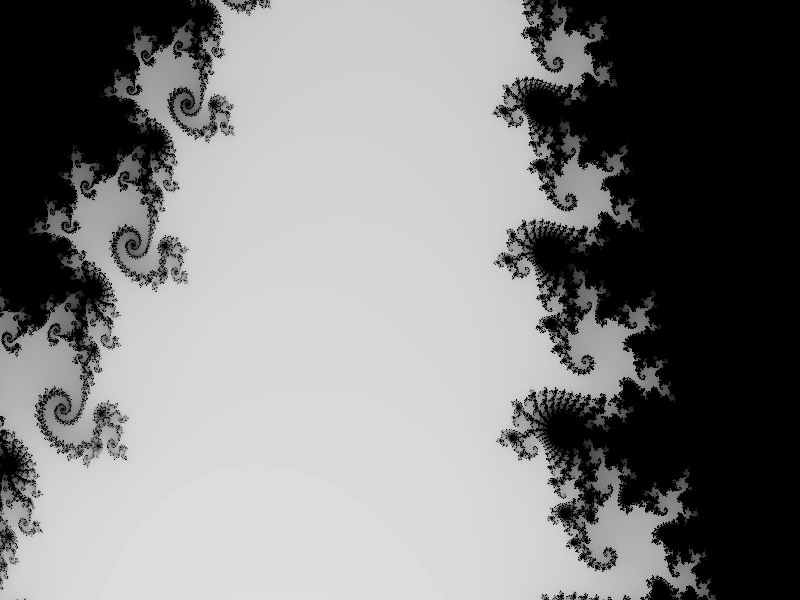
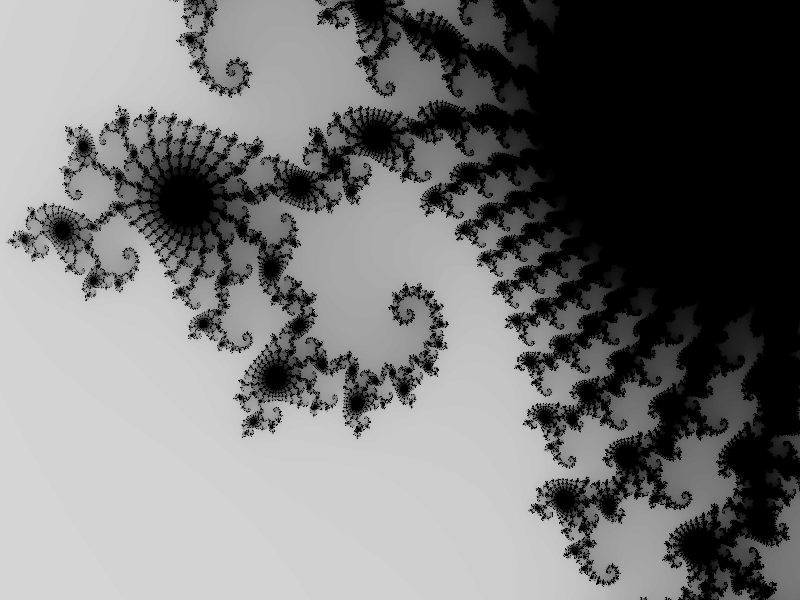
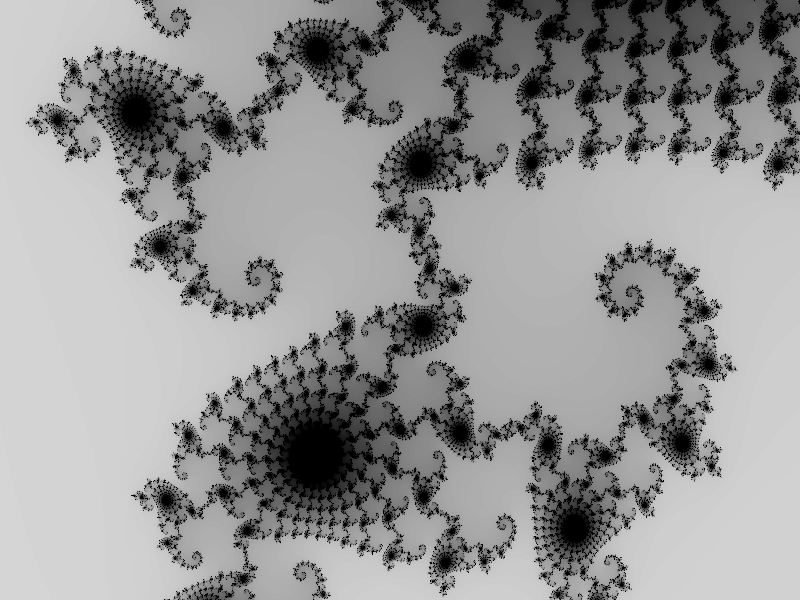
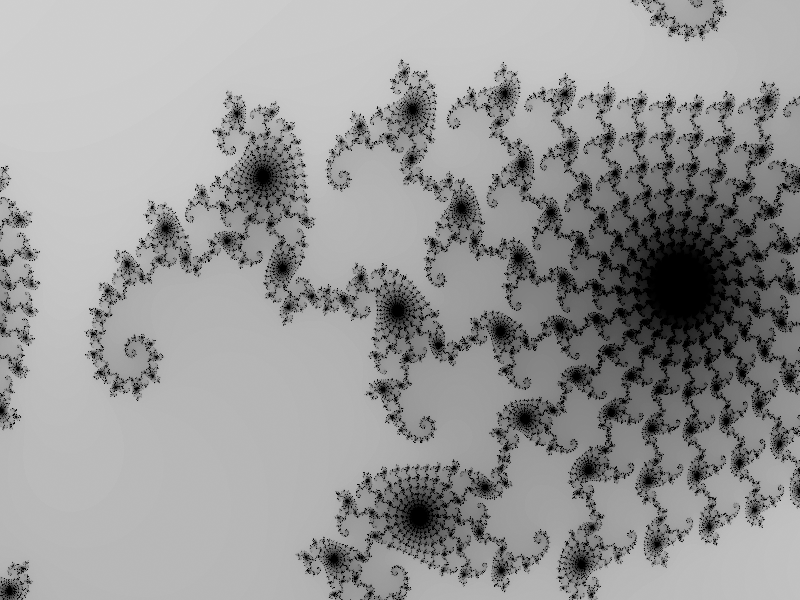
Here are some of the sights which are to be found on the way…
Down the Rabbit Hole…
So what happens, if we keep zooming in?
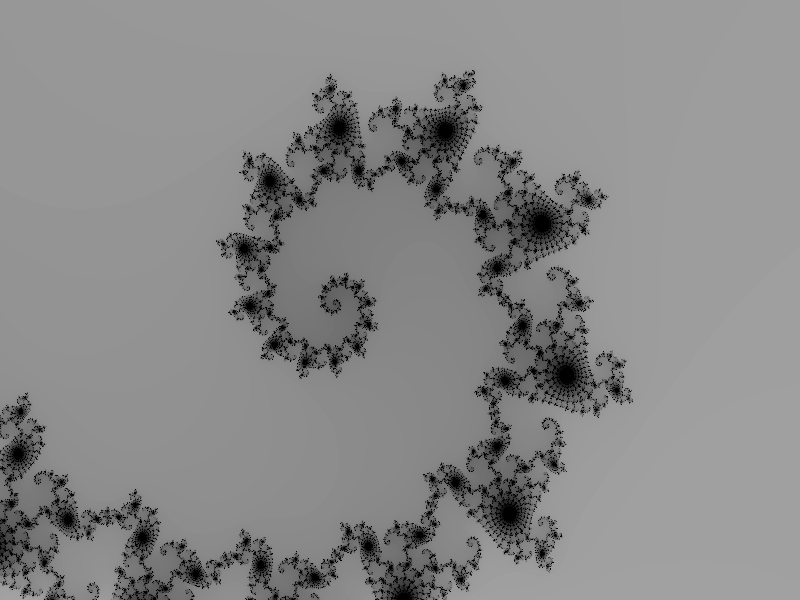
Eventually…
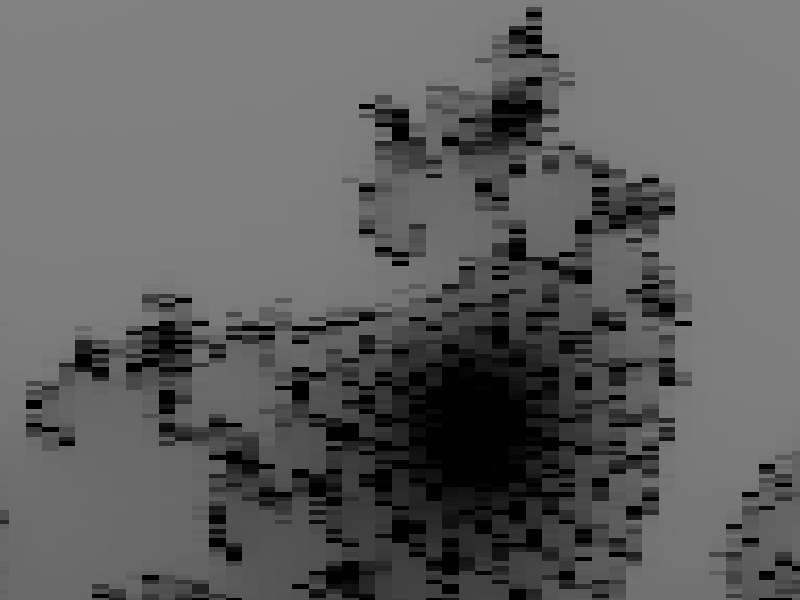
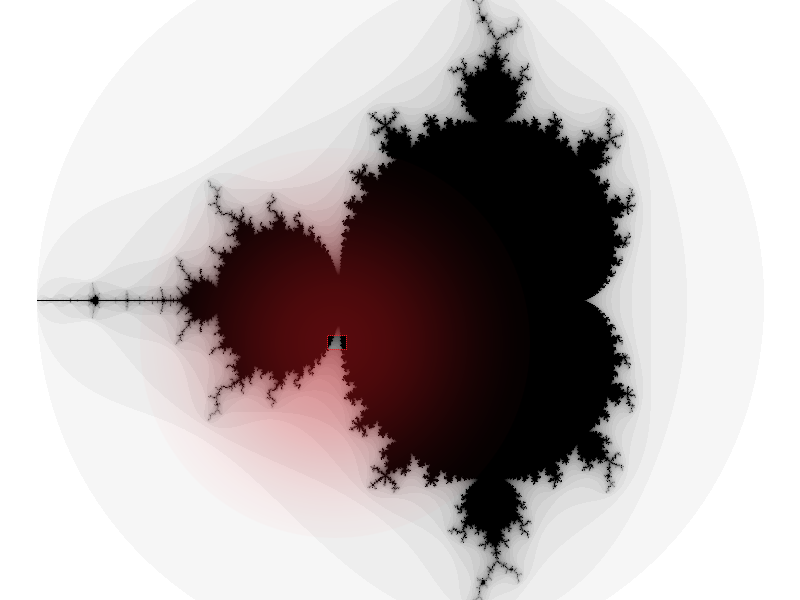
There’s a German saying, “This is, where the hare is sitting in the pepper”, meaning, we’ve arrived at the truth of the matter, revealing its hidden nature. And, indeed, it does look like somewhat of a hare, peppered by binary floating point number representation.
We have hit a resolution barrier, which is caused by the numeric precision, the way numbers are stored in a binary computer. As our humble renderer happens to be in JavaScript, fractional numbers are represented in floating point format of 64 bits, according to the IEEE 754 standard (52 bit mantissa, 11 bits exponent and a sign bit). We just hit the limits of precisions and factors are so small that they can’t be represented anymore (therefore effectively zero), because we ran out of bits for both the mantissa and the exponent. If we keep zooming in further, the “pixels” will only increase in size, without revealing any more information. What we’re looking at is the absolute information barrier of binary mathematics, the grain of binary computers.
Norbert Landsteiner,
Vienna, 2019-02-05 (updated 2019-04-30)